TikTok Shopping Statistics: GMV, Seller Data and Live Commerce Trends
TikTok Shop reached $15.1 billion in US sales in 2025, up 68%. What the figures show about sellers, live commerce, and where the growth actually came from.

TikTok Shop’s US gross merchandise value reached $15.1 billion in 2025, up 68% from roughly $9 billion the year before. That is the headline figure from Momentum Works and Tabcut, published in February 2026, and it is the number most coverage stops at.
The more useful part of the data is underneath it: where those sales came from, how few sellers captured them, and how small the whole thing still is next to ordinary online retail.
The number in context
$15.1 billion sounds substantial in isolation. Set against the size of US online retail, it is a rounding error that happens to be growing quickly.
The Census Bureau put US retail e-commerce at $326.7 billion in the first quarter of 2026 alone, or 16.9% of all retail sales. TikTok Shop’s entire 2025 US total is under 5% of one quarter of US online spending.
| Measure | Figure | Period |
|---|---|---|
| TikTok Shop US GMV | $15.1B | Full year 2025 |
| US retail e-commerce | $326.7B | Q1 2026 only |
| E-commerce share of US retail | 16.9% | Q1 2026 |
That framing matters because TikTok Shop is frequently discussed as though it were displacing conventional e-commerce. On the current numbers it is not. It is adding a discovery-led channel alongside it, and doing so fast.
Globally the picture is different. TikTok Shop turned over $64.3 billion across 16 markets in 2025, up 94%. Southeast Asia accounted for $45.6 billion of that — three times the US figure. Indonesia by itself was larger than the entire American market. The US is not TikTok Shop’s centre of gravity, and reading the platform through US coverage alone gives a distorted view.
The year was extremely back-loaded
TikTok Shop’s US GMV was $5.8 billion in the first half of 2025, up 91% year over year. The full year came in at $15.1 billion.
That arithmetic is worth doing explicitly: the second half delivered about $9.3 billion — roughly 62% of the year in six months. Momentum Works notes that November and December alone accounted for close to 30% of annual GMV, driven by Black Friday, Thanksgiving and Christmas campaigns.
| Period | US GMV | Share of year |
|---|---|---|
| H1 2025 | $5.8B | ~38% |
| H2 2025 | ~$9.3B | ~62% |
| Nov–Dec 2025 | ~$4.5B | ~30% |
Two consequences follow. First, any mid-year run-rate extrapolation of TikTok Shop’s US business will understate it substantially — doubling an H1 figure gets you to $11.6 billion, not $15.1 billion. Second, the business is more seasonally concentrated than general e-commerce, which makes single-quarter comparisons against Amazon or Walmart misleading in both directions depending on the quarter chosen.
Note that the H2 and November–December figures above are derived by subtraction from the two published totals, not separately reported.
Share of the social commerce market
EMARKETER forecasts US social commerce sales will pass $100 billion in 2026, at $100.99 billion, an 18% increase. Working back at that growth rate puts 2025 at roughly $85.6 billion.
Against that base, TikTok Shop’s $15.1 billion is about 18% of all US social commerce — a large share of a category that itself represents only 6.9% of US retail e-commerce, on EMARKETER’s numbers, rising toward 9.3% by 2029.
The US social buyer base reached 108.3 million people in 2025, up 6.8%, with 47.5% of US digital buyers making at least one social purchase in the year. So social buying is now a majority-adjacent behaviour among online shoppers, but the spend per buyer remains modest — roughly $790 a year across all social platforms combined, on the 2025 figures.
Where the sales actually happen
TikTok Shop has three surfaces, and they do not contribute equally.
| Surface | Share of US GMV 2025 |
|---|---|
| In-feed video | 50% |
| Shop tab | 36% |
| Live commerce | 14% |
Half of everything sold goes through ordinary short-form video — a creator holds something up, a link sits underneath, someone taps it. That is the mechanism the platform was built around and it remains the dominant one. It also puts unusual weight on how the product is shot: the figures in our product photography statistics report apply directly here, because the video frame is the only product page many buyers see.
The Shop tab at 36% is worth noting because it is the most conventional part of the product. It behaves like a marketplace: people arrive intending to browse and buy. Its size suggests a meaningful share of TikTok Shop volume is not impulse discovery at all.
Live commerce gets attention disproportionate to its size. It grew from 10% of US GMV in 2024 to 14% in 2025, which is real growth, but it is still the smallest of the three surfaces. TikTok reported more than 8 million hours of live shopping hosted in the US during 2024.
The blockbuster livestream is getting rarer
One figure in the H1 2025 data runs directly against the narrative. The number of individual US live sessions exceeding $1 million in GMV fell to one in the first half of 2025, down from four in 2024.
So live commerce grew as a share of total sales while its biggest single events became less frequent. The most consistent reading is that live selling on TikTok is broadening rather than concentrating: more sellers running more sessions at smaller individual volumes, rather than a handful of tentpole broadcasts driving the category.
For sellers, that is arguably the more encouraging shape. It suggests live commerce on TikTok is becoming a routine channel rather than a lottery in which only a few mega-streams matter. It also means benchmarks built on the headline mega-stream numbers from 2023 and 2024 are not a useful target.
Most shops sell nothing
This is the figure that changes how the rest of the data should be read.
Of the roughly 803,500 US storefronts on TikTok Shop in 2025, more than half recorded no sales at all. Just over 2,000 shops cleared $1 million in GMV — about one in every 400.
So the distribution looks like this:
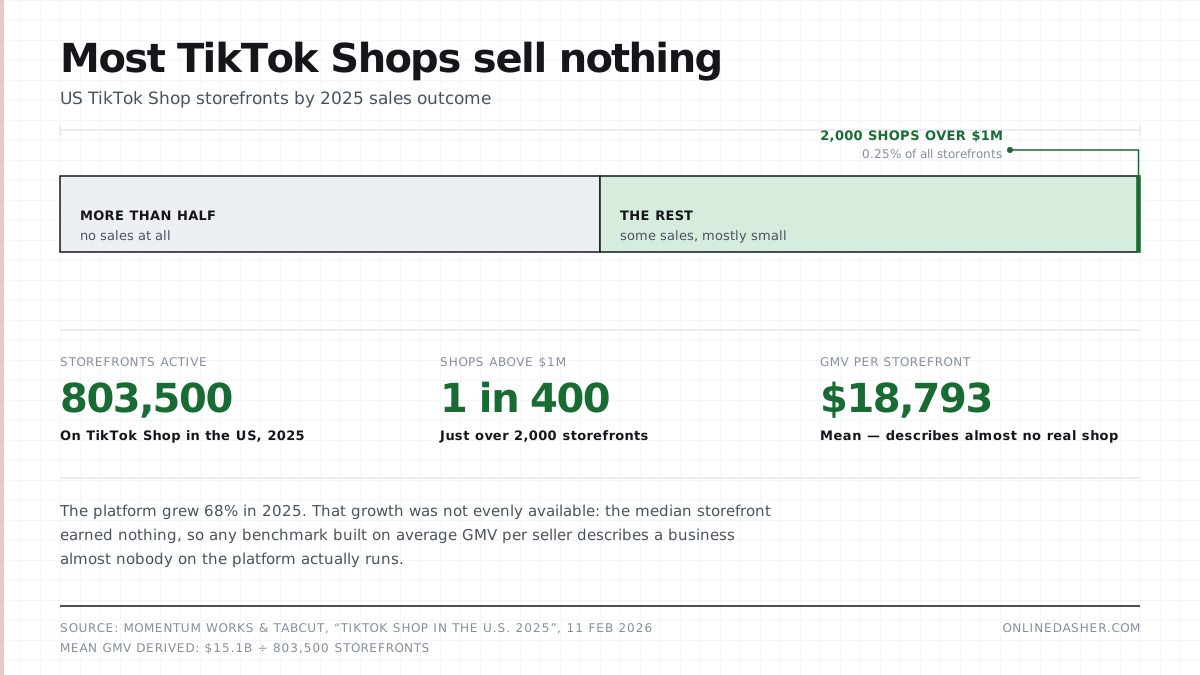
This is the reason we publish the seller count and the zero-sales share together rather than quoting a per-seller average — the same discipline described on our methodology page.
The platform’s aggregate growth is genuine, but it is not evenly available. A seller opening a TikTok Shop is joining a market where the median outcome is no revenue. Any projection built on “average GMV per seller” will be badly wrong, because the average is dragged up by a very small number of very large accounts and the median sits near zero.
This is not unique to TikTok — marketplace revenue distributions are almost always heavily skewed — but the skew here is unusually steep for a platform this young.
Who is actually on the platform
Pew Research Center found 37% of US adults use TikTok in its 2025 survey, conducted between February and June of that year. The age gradient is steep: roughly half of 18- to 29-year-olds open the app daily, against 5% of adults 65 and older.
For anyone sizing a TikTok Shop opportunity, that gradient is the constraint. The addressable audience is not “US adults” — it is a young, mobile-first slice of them, weighted toward women, and the products that perform reflect that.
It is worth setting that against voice as a discovery channel, which had a comparable wave of coverage several years earlier: our Amazon Alexa statistics report tracks how installed-base growth and actual purchasing behaviour came apart.
What sells
The category ranking follows the audience:
| Rank by size | Category | Fastest-growing categories |
|---|---|---|
| 1 | Beauty and personal care | Kids’ fashion |
| 2 | Womenswear and underwear | Baby and maternity |
| 3 | Sports and outdoors | Muslim fashion |
The presence of Muslim fashion among the fastest-growing categories is a reminder of where TikTok Shop’s volume actually sits: Indonesia was the platform’s largest single market in the first half of 2025 at $6 billion, ahead of the United States at $5.8 billion. Category rankings published as “TikTok Shop trends” often blend global and US data without saying so.
Pricing moved down across most of the platform. Of 27 tracked categories, 15 saw average prices fall in 2025. The exception was jewellery accessories, up 36%. Falling prices alongside rising GMV means unit volume grew faster than the revenue figure suggests — the platform is selling considerably more things, somewhat cheaper.
The small-business layer
TikTok reports more than 171,000 local and small businesses selling on the US platform, with sales to those businesses up 70% year over year. The company says over a third of US purchases each month in 2024 went to small businesses.
The platform hosts 70+ million products across 750+ categories, and TikTok says it has invested close to $1 billion in safety tooling and staff.
These are company-reported figures. They are not independently audited, and the definitions — what counts as a “small business”, what counts as a “product” — are TikTok’s own.
The contrast with a mature retention programme is instructive. Discovery commerce buys attention transaction by transaction; the mechanics in our Starbucks customer loyalty statistics report show what the same spend looks like when it is directed at repeat purchase instead.
Reading seller benchmarks without being misled
Three of the figures above interact in a way that makes most published “TikTok Shop seller benchmarks” unreliable, and it is worth spelling out why.
Aggregate GMV grew 68%. Average prices fell in 15 of 27 categories. More than half of storefronts made no sales at all. Put together, those tell you that unit volume grew faster than 68%, that the growth was concentrated in the minority of shops that sell anything, and that any per-seller average computed by dividing $15.1 billion by 803,500 shops — about $18,800 — describes almost no real business on the platform.
The median active shop is far below that figure; the 2,000-odd shops above $1 million are far above it. When a benchmark quotes an average monthly seller revenue without stating whether it excludes zero-sale shops, it is not a number you can plan against.
The same caution applies to growth rates. A seller comparing their own year against the platform’s 68% is comparing against a figure inflated by new storefronts entering the denominator and by the extreme fourth-quarter concentration described above.
What the discovery numbers do and do not show
A GlobalData survey commissioned by TikTok found:
- 83% of shoppers discovered a new product on TikTok Shop
- 70% discovered a new brand
- 76% of those who engaged with TikTok Shop bought something from a livestream in the past year
The direction is plausible and consistent with how the platform works. The provenance is not independent: TikTok commissioned the research and selected what to publish from it. The 76% livestream figure in particular is conditioned on people who already engaged with TikTok Shop, which is a self-selecting group — it does not mean 76% of TikTok users buy from livestreams.
We include these numbers because they are the best available on discovery behaviour and because they are clearly attributed. They should carry less weight than the GMV and Census figures above.
What these numbers cannot tell you
Three limitations are worth stating plainly.
GMV is not audited. TikTok does not publish gross merchandise value. The $15.1 billion figure is an estimate produced by Momentum Works and Tabcut from platform data. The magnitude and the growth rate are well supported; the precise decimal is not a filed number.
GMV is not revenue. It counts goods sold before returns, cancellations and discounts. Return rates in fashion and beauty — TikTok Shop’s two largest categories — are high. Net settled value is meaningfully lower than $15.1 billion, by an amount nobody outside TikTok can calculate.
Regulatory status affects forward projections. TikTok’s ownership and operating position in the US has been subject to legal and political change. Any multi-year forecast for the US figure carries a risk that has nothing to do with commerce.
Related reading
- Product photography statistics — how imagery moves conversion, which is what an in-feed video is doing
- Amazon Alexa statistics — the previous discovery channel that grew its installed base faster than its purchasing
- Starbucks customer loyalty statistics — retention economics against discovery economics
- All research — everything currently on record
- How we source figures — what we will and will not publish
Frequently asked
20 entriesHow much did TikTok Shop sell in the US in 2025?
$15.1 billion in gross merchandise value, according to Momentum Works and Tabcut. That is up 68% from roughly $9 billion in 2024.
Is that revenue or sales volume?
It is gross merchandise value — the total value of goods sold through the platform before returns, cancellations and discounts. It is not TikTok's revenue. TikTok's own income is the commission and advertising layered on top of that figure.
How big is TikTok Shop compared to US e-commerce overall?
Small. US retail e-commerce ran at $326.7 billion in the first quarter of 2026 alone. TikTok Shop's entire 2025 US figure is under 5% of a single quarter of US online retail.
How many sellers are on TikTok Shop in the US?
About 803,500 storefronts were active in 2025. More than half of them recorded no sales at all during the year.
How many sellers actually make meaningful money?
Just over 2,000 US storefronts passed $1 million in GMV in 2025 — roughly one in every 400 shops on the platform.
Where do TikTok Shop sales actually happen?
In 2025, about 50% of US GMV came from in-feed video, 36% from the Shop tab, and 14% from live commerce.
Is live shopping growing on TikTok?
Yes, but from a small base. Live commerce went from 10% of US GMV in 2024 to 14% in 2025. It is the fastest-growing channel but still the smallest of the three.
Which product categories sell best?
Beauty and personal care is the largest category, followed by womenswear and underwear, then sports and outdoors.
Which categories are growing fastest?
Kids' fashion, baby and maternity, and Muslim fashion showed the fastest growth in 2025, according to the Momentum Works and Tabcut report.
Are prices on TikTok Shop rising or falling?
Mostly falling. Of 27 tracked categories, 15 saw average prices decline in 2025. Jewellery accessories was the notable exception, up 36%.
How many Americans actually use TikTok?
37% of US adults, according to Pew Research Center's 2025 survey. Usage skews young — around half of 18- to 29-year-olds open the app daily, against 5% of those 65 and over.
Do people buy things they did not plan to buy?
A GlobalData survey commissioned by TikTok found 83% of shoppers said they discovered a new product on TikTok Shop and 70% discovered a new brand. Note that TikTok commissioned this research, so treat it as directional rather than independent.
How does TikTok Shop compare to Amazon?
Not closely. Amazon operates at a scale roughly two orders of magnitude larger in US online retail. TikTok Shop is a discovery channel that converts, not a general-purpose marketplace.
Is TikTok Shop bigger in the US or Southeast Asia?
Southeast Asia, by a wide margin — $45.6 billion versus $15.1 billion in 2025. Indonesia alone was larger than the entire US market.
What was TikTok Shop's global GMV?
$64.3 billion across 16 markets in 2025, up 94% year over year.
How seasonal is TikTok Shop?
Heavily. US GMV was $5.8 billion in the first half of 2025 and roughly $9.3 billion in the second — about 62% of the year in six months. November and December alone were close to 30% of annual volume.
What share of US social commerce is TikTok Shop?
Roughly 18%. EMARKETER puts US social commerce at about $85.6 billion in 2025, rising past $100 billion in 2026. TikTok Shop's $15.1 billion is a large slice of that, though social commerce is itself only 6.9% of US retail e-commerce.
How many Americans buy through social media at all?
EMARKETER counted 108.3 million US social buyers in 2025, up 6.8%, representing 47.5% of US digital buyers.
Are million-dollar livestreams still happening?
Less often. US live sessions clearing $1 million in GMV fell to one in the first half of 2025, from four in 2024 — even as live commerce grew as a share of sales. Live selling appears to be broadening across many smaller sessions rather than concentrating in a few large ones.
How reliable are these numbers?
The GMV figures come from Momentum Works and Tabcut, who estimate them from platform data rather than audited filings. TikTok does not publish GMV itself. Treat the direction and rough magnitude as sound and the precise decimal as an estimate.
Sources
6 referenced- US Census Bureau
· Official
Quarterly Retail E-Commerce Sales, First Quarter 2026
Published 2026-05-18 · last verified 2026-08-04 - TikTok
· Company filing
TikTok Shop is where shoppers come to discover
Published 2025-06-13 · last verified 2026-08-04 - EMARKETER
· Research
US Social Commerce Sales Will Surpass $100 Billion in 2026
Published 2026 · last verified 2026-08-04 - Momentum Works
· Research
TikTok Shop U.S. GMV grew 68% to reach US$15.1B in 2025
Published 2026-02-11 · last verified 2026-08-04 - Momentum Works
· Research
TikTok Shop doubles global GMV in H1 2025, with U.S. market hitting US$5.8 billion
Published 2025-07-31 · last verified 2026-08-04 - Pew Research Center
· Research
Americans' Social Media Use 2025
Published 2025-11-20 · last verified 2026-08-04