Product Photography Statistics: Ecommerce Image and Returns Data
Product photography statistics from usability testing and returns data: what shoppers do with images, how many sites get it wrong, and what it costs.
Most published product photography statistics cannot be traced to anyone. The figures below can: they come from Baymard Institute’s usability benchmark, from the National Retail Federation’s returns study, and from the US Census Bureau.
What they show is narrower and more useful than the usual claim that better images lift conversion. Images are the part of a product page shoppers use first and trust most, a third of sites fail at the single job images are asked to do, and the cost of that failure shows up in returns rather than in conversion rate.
What shoppers actually use images for
The most-quoted product photography statistics treat images as persuasion. The testing evidence suggests they are closer to specification.
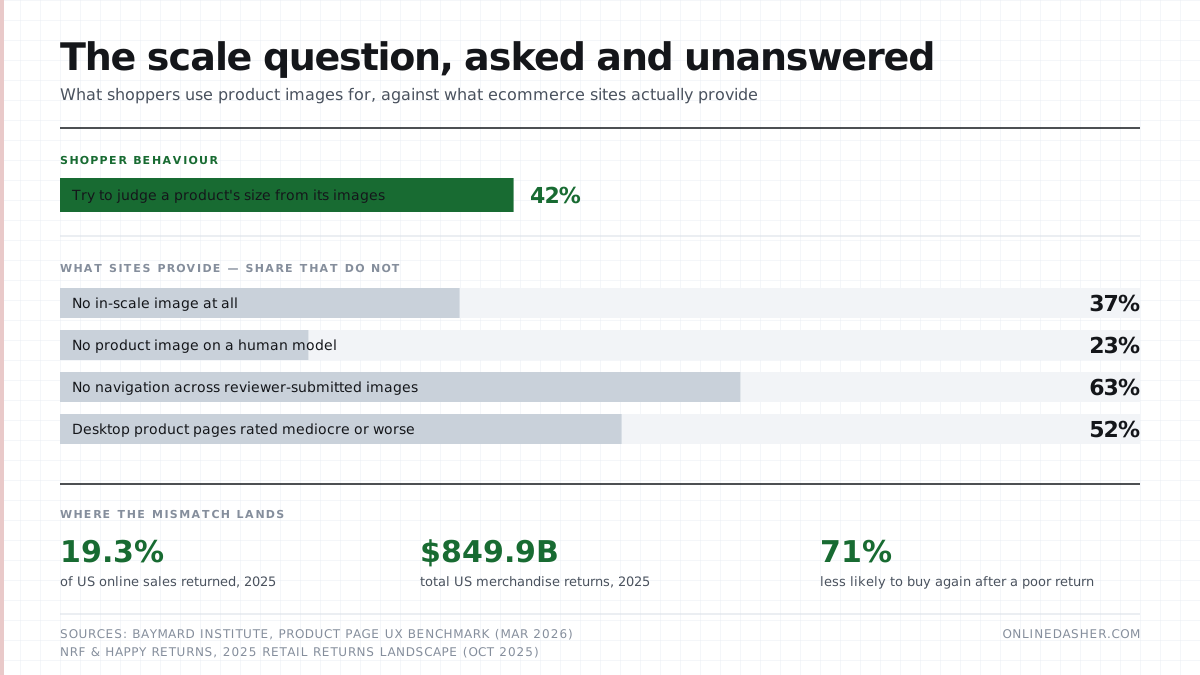
Baymard Institute’s product page research — built on more than 30,000 manually rated usability scores across 155-plus benchmarked ecommerce sites — found that 42% of users try to ascertain the size of a product from its images. Not the style, not the mood: the physical dimensions.
That is a question the copy usually answers badly. Dimensions in millimetres require the reader to do arithmetic against objects they cannot see. An image that places the product next to a hand answers it instantly.
A third of sites do not answer it
Against that behaviour, the implementation record is poor:
| Gap | Share of benchmarked sites |
|---|---|
| No in-scale image | 37% |
| No image on a human model | 23% |
| No navigation across reviewer-submitted images | 63% |
| Return policy not shown or linked on the product page | 44% |
An in-scale image shows the product against a known reference so the viewer can judge its size without converting units. More than a third of sites offer none, while 42% of their visitors are trying to work out exactly that.
The overall picture is not flattering either. Baymard rates 52% of desktop product pages, 62% of mobile pages and 64% of app pages as mediocre or worse for usability. Product pages are where the buying decision happens, and most of them are below a competent standard.
Where the cost lands
Conversion is the metric product photography is usually sold on. Returns are where the larger number sits.
The National Retail Federation, with Happy Returns, put US merchandise returns at $849.9 billion in 2025 — 15.8% of annual retail sales. Online is worse: 19.3% of online sales came back.
| Measure | 2025 | 2024 |
|---|---|---|
| Total returns | $849.9B | $890B |
| Returns as share of sales | 15.8% | 16.9% |
| Online return rate | 19.3% | — |
| Holiday season return rate | 17% | — |
Set that against the size of the channel. The Census Bureau recorded $326.7 billion in US retail e-commerce in the first quarter of 2026 alone, 16.9% of all retail sales. At the 19.3% online return rate, roughly $63 billion of online merchandise comes back in a single quarter — a derived figure, obtained by applying the NRF rate to the Census volume, not a number either body publishes.
Returns also cost the next order. NRF found 71% of shoppers are less likely to buy from a retailer again after a poor returns experience, up from 67% a year earlier.
Who returns, and why that shapes the photography argument
The returns figure is often quoted as though it were a single behaviour. The NRF data separates it into several, and only one of them is an information problem.
Among the findings in the 2025 study:
- Gen Z shoppers aged 18 to 30 averaged 7.7 online returns in the previous twelve months.
- Nearly two-thirds of consumers admitted to “costly returns behaviour” — practices that impose cost on the retailer beyond a straightforward refund.
- 45% consider “bending the truth” acceptable when making a return.
- 9% of all returns are fraudulent. Within tracked fraud types, overstated quantity accounted for 71%, empty-box returns 65%, and counterfeit decoy items 64%.
Read together, these say something uncomfortable for the standard product photography pitch: a meaningful share of returns is not caused by any failure of the listing. A shopper who orders three sizes intending to keep one has not been misled, and no photograph changes their plan.
What the photography argument can legitimately claim is the residual — the returns where the buyer expected something the delivery did not match. That is real, and given the size of the base it does not need to be a large percentage to matter. But it is a share of a share, and any statistic implying otherwise is overstating the mechanism.
What else the benchmark found
Baymard’s product page work extends past imagery, and the surrounding failures are worth knowing because they compete for the same development time.
| Product page element | Share of sites failing it |
|---|---|
| No “price per unit” display | 81% |
| No guest “save for later” | 89% |
| No response to negative reviews | 89% |
| No gifting options | 78% |
| No total order cost estimate | 67% |
| Size selection not offered as buttons | 57% |
| Return policy not shown or linked | 44% |
The return-policy gap is the one that interacts directly with everything above. 60% of shoppers expect return policy information on the product page, and 44% of sites do not put it there. A shopper who cannot judge size from the images and cannot find the return terms is being asked to accept two risks at once.
Note also the sample behind these numbers, because it is unusually explicit for this subject: more than 30,000 manually rated usability scores across 155-plus benchmarked US and European ecommerce sites, against 115-plus product page guidelines. That is a different class of evidence from a vendor survey, and it is why we use it.
What photography can and cannot fix
This is where most ecommerce product photography advice overreaches, so it is worth being precise about the mechanism.
Photography can reduce the returns that come from a gap between what the buyer expected and what arrived — wrong size, wrong colour, wrong material weight, wrong scale. Those are failures of information, and images are the fastest way to supply it.
Photography cannot touch:
- Bracketing. Ordering three sizes intending to keep one is a deliberate strategy, not a misunderstanding.
- Fraud. NRF puts fraudulent returns at 9% of the total, including overstated quantity (71% of tracked fraud types) and empty-box returns (65%).
- Changed minds. No image prevents a buyer deciding they no longer want the item.
Any claim that better photography cuts total returns by some headline percentage is claiming authority over categories it does not touch. The honest framing is narrower: it addresses the expectation-mismatch share, which nobody has cleanly isolated in public data.
The figures we left out
Several numbers appear in almost every article on this subject. We do not publish them, and the reason is worth stating because it is the whole basis of this site’s methodology.
- “High-resolution images increase conversion by 33%” — no traceable origin.
- “87% of consumers say product photos are very important” — attributed to different surveys in different years, none locatable.
- “Pages with images get 95% more organic traffic” — no primary source; the earliest citations point at each other.
- “22% of returns happen because the item looked different online” — plausible and widely repeated, but we could not find the study.
These may all be directionally true. None of them is verifiable, and a figure you cannot source is a figure you should not put in front of someone who might quote it.
Practical reading of the data
Three things follow from the numbers above, and only from them.
Scale reference is the highest-leverage single addition. 42% of shoppers are looking for size; 37% of sites do not provide it. That gap is unusually cheap to close — one additional frame per product, with a hand or a known object in shot.
Human models are scale references, not styling. For anything worn or held, a model resolves both size and proportion at once. 23% of sites are leaving that on the table.
Reviewer images are an unused asset. 63% of sites do not let shoppers browse customer-submitted photos as a gallery. Those images already exist, cost nothing to produce, and show the product in the conditions buyers actually care about.
None of this requires a studio budget. It requires deciding that the images have a job to do beyond looking good.
A note on how to read any product photography statistic
Three questions separate the usable figures on this subject from the rest, and they are worth applying to anything quoted here included.
Who was measured, and how many? Baymard’s numbers rest on 30,000-plus rated scores across 155-plus sites. A figure from an unnamed “study of shoppers” with no sample size is not comparable, whatever it claims.
Is it behaviour or opinion? “42% try to judge size from images” is observed behaviour in moderated testing. “87% say images are very important” is a stated preference, and stated preference is a weak predictor of what people do. Most circulating photography statistics are the second kind presented as the first.
Does the number have a mechanism? A conversion-lift claim with no account of what changed for the shopper is not a finding, it is a correlation waiting for an explanation. The scale-reference gap has a mechanism: the shopper needs a size, the image supplies it or does not, and the consequence is measurable in returns.
Applied consistently, those three tests remove most of what is written about ecommerce product photography — including several numbers this page used to repeat before it was rebuilt.
Ordering the work
The figures above support a rough priority order. This ranking is ours, derived by weighting each gap by how many shoppers are known to be affected by it — it is not something Baymard or NRF publish.
| Priority | Fix | Sites failing | Why it ranks here |
|---|---|---|---|
| 1 | Add an in-scale frame | 37% | 42% of shoppers are actively looking for this answer |
| 2 | Surface the return policy | 44% | 60% expect it on the page; it caps the perceived risk |
| 3 | Add a human-model frame | 23% | Resolves scale and proportion together for worn items |
| 4 | Open the reviewer gallery | 63% | Largest gap, but the images already exist at zero cost |
The reviewer gallery sits fourth despite being the biggest gap because it is the one shoppers can partly work around — the photos are usually reachable, just not browsable. The in-scale frame ranks first because there is no workaround at all: if the image does not answer the size question, nothing else on the page does.
Worth noting what is absent from this list. Resolution, lighting quality and retouching standard do not appear, because no source we accept quantifies their effect. That is not a claim they do not matter — it is an admission that the evidence for them is not there, which is a different statement from the one most articles on ecommerce product photography make.
Where this connects
Product imagery is being asked to do more, not less, as commerce moves into feed and video contexts. In video-led selling the frame is often the only product page a buyer sees — the channel-mix data in our TikTok shopping statistics report shows half of that platform’s US sales running through in-feed video.
The comparison with voice is instructive in the other direction: our Amazon Alexa statistics report covers a channel where imagery was removed entirely, and where purchasing never followed the installed base. And where imagery reduces returns, it is doing retention work — the same economics tracked in our Starbucks customer loyalty statistics report.
Related reading
- TikTok shopping statistics — where the video frame replaces the product page
- Amazon Alexa statistics — a channel with no images at all
- Starbucks customer loyalty statistics — the retention side of the same equation
- All research — everything currently on record
- How we source figures — including what we refuse to publish
Frequently asked
16 entriesWhat do shoppers actually do with product images?
They use them to answer questions the text cannot answer quickly. Baymard's testing found 42% of users try to work out a product's physical size from the images alone.
How many ecommerce sites have poor product pages?
More than half. Baymard rates 52% of desktop product pages, 62% of mobile ones and 64% of app ones as mediocre or worse for usability.
What is an in-scale image?
An image that shows the product against something of known size — a hand, a room, a standard object — so the viewer can judge how big it is. 37% of benchmarked sites offer none.
Why does in-scale imagery matter commercially?
Because size is the question images are asked most often and answered worst. A shopper who guesses wrong finds out after delivery, and the correction arrives as a return.
How much merchandise gets returned?
US retailers took back $849.9 billion in 2025, or 15.8% of annual sales, according to NRF and Happy Returns.
Are online returns worse than in-store?
Yes. 19.3% of US online sales came back in 2025, against 15.8% across all retail.
How much online merchandise is that in absolute terms?
US retail e-commerce ran at $326.7 billion in the first quarter of 2026. At a 19.3% return rate, roughly $63 billion of online merchandise comes back in a single quarter.
Do returns cost more than the refund?
They cost the relationship too. NRF found 71% of shoppers are less likely to buy from a retailer again after a poor returns experience, up from 67% the year before.
Can better photography actually reduce returns?
It can reduce the subset of returns caused by mismatch between expectation and delivery. It cannot touch returns from bracketing, fraud or changed minds — and NRF puts fraudulent returns alone at 9%.
How many product images should a listing have?
Baymard's testing indicates three or more are needed in list and search contexts before users have enough visual information to choose.
Do human models matter?
For anything worn or held, yes — they are the cheapest form of scale reference. 23% of benchmarked sites show no image on a human model at all.
What about customer-submitted photos?
They are underused as a navigable gallery: 63% of sites do not let shoppers browse across reviewer-submitted images.
Is product photography a conversion lever or a returns lever?
Both, and the returns side is usually the larger number. Conversion gains are capped by traffic; returns are a percentage of everything already sold.
How reliable are the widely quoted photography statistics?
Many are not. Figures such as "high-resolution images lift conversion 33%" circulate without a traceable origin. We exclude them; every number here names its source.
Where does this data come from?
Baymard Institute's product page benchmark (30,000+ manually rated usability scores across 155+ sites), NRF and Happy Returns' 2025 returns study, and US Census Bureau e-commerce figures.
Does any of this apply to video commerce?
Directly. In feed-based selling the video frame is the only product page many buyers see, which raises the stakes on scale and material cues rather than lowering them.
Sources
3 referenced- US Census Bureau
· Official
Quarterly Retail E-Commerce Sales, First Quarter 2026
Published 2026-05-18 · last verified 2026-08-04 - National Retail Federation
· Industry body
Consumers Expected to Return Nearly $850 Billion in Merchandise in 2025
Published 2025-10-15 · last verified 2026-08-04 - Baymard Institute
· Research
Product Page UX Best Practices 2026
Published 2026-03-18 · last verified 2026-08-04