Amazon isn’t just conquering the online marketplace; it’s reshaping the way we experience in-store shopping. In 2022, the tech giant saw its physical store sales surge by a remarkable 12.5%, raking in almost $19 billion from physical retailing worldwide.
Intrigued?
Let me share the most crucial Amazon Go statistics you should be aware of right away.
Amazon Go Statistics: The Key Data
- Amazon’s physical store sales increased 12.5% in 2022.
- Net sales from Amazon’s physical retailing has reached nearly $19 billion globally in 2022.
- 59% of shoppers in the US think that Amazon Go will hurt other stores.
- 54% of customers who visited an Amazon Go said their visit was “excellent.”
- Only 28% of people visited an Amazon Go location.
- Approximately 20% of shoppers had never heard of the Amazon Go store.
- As of 2023, Amazon Go has 43 locations in Seattle, Chicago, London, and New York City.
- Amazon spent more than $1 million on hardware for the first Amazon Go location.
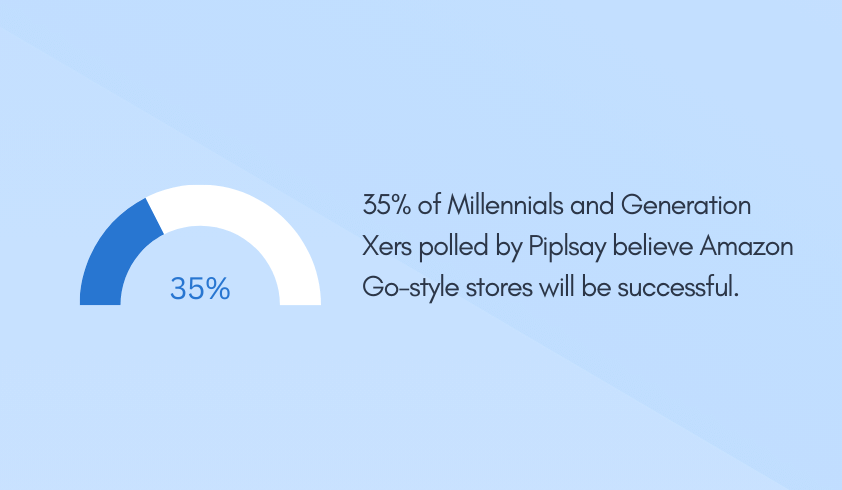
- 35% of Millennials and Generation Xers polled by Piplsay believe Amazon Go-style stores will be successful.
- Amazon Go customers spend between $7 and $15 per shopping trip on average.
Sources: (Winsight Grocery Business, Forrester Research, Grocery Dive, Supermarket News, Academic Accelerator, Vested Finance, Retail Dive.)
Amazon Physical Store Sales Jump 12.5% in 2022.
Important takeaway:
| Insight from Data | Rationale |
| Significant growth in offline presence. | Shift in consumer behavior towards in-person shopping. |
| Diversification of Amazon’s revenue stream. | Less reliance on online channels boosts resilience. |
| Competitive landscape in retail is shifting. | Traditional retailers face enhanced challenges from tech giants. |
Source: Winsight Grocery Business
Amazon’s Physical Retail Nets $19 Billion Globally in 2022.
Important takeaway:
| Insight from Data | Rationale |
| Amazon’s physical retailing remains a major channel. | Despite digital dominance, brick-and-mortar stores held strong financial significance. |
| Global market values physical store experiences. | Physical retail success indicates a demand for in-person shopping experiences. |
| Amazon is diversifying its revenue streams. | Beyond e-commerce, Amazon taps into traditional retail channels to widen its reach. |
Source: Forrester Research
59% of US Shoppers View Amazon Go as Retail Threat.
Important takeaway:
| Insight from Data | Rationale |
| Amazon Go is perceived as a significant competitor in retail. | Majority of US shoppers recognize its disruptive potential in the market. |
| Traditional retailers need to innovate to retain market share. | Given the threat perception, status quo may lead to a loss of customers. |
| The convenience of Amazon Go is resonating with consumers. | The high percentage indicates that its model offers something compelling to the shoppers. |
Source: Grocery Dive
54% Rate Amazon Go Visit as “Excellent” Experience.
Important takeaway:
| Insight from Data | Rationale |
| Amazon Go is setting a high standard for retail experience. | Over half of the visitors found their experience outstanding. |
| Positive experiences can lead to repeat business for Amazon Go. | High satisfaction often translates to customer loyalty and retention. |
| Competing retailers must prioritize user experience. | To match or exceed Amazon Go, focus on improving store experiences is crucial. |
Source: Supermarket News
Only 28% Have Visited an Amazon Go Store in 2022.
Important takeaway:
| Insight from Data | Rationale |
| Amazon Go’s reach is still limited in the broader market. | Less than a third of the surveyed individuals have visited. |
| There’s potential for Amazon Go to expand its audience. | The large untapped market suggests growth opportunities. |
| Awareness doesn’t necessarily translate to store visits. | Despite its brand presence, many have yet to experience the store firsthand. |
20% Shoppers Unaware of Amazon Go Store’s Existence.
Important takeaway:
| Insight from Data | Rationale |
| There’s a segment of the market untouched by Amazon Go’s branding. | A fifth of shoppers remain unaware of the Amazon Go concept. |
| Amazon Go can benefit from increased marketing efforts. | Enhancing brand awareness can further penetrate the potential market. |
| Not all shoppers are aligned with tech-driven retail trends. | Traditional shopping habits and limited exposure might keep some consumers uninformed. |
Source: Supermarket News
2023: 43 Amazon Go Stores Across Four Major Cities.
Important takeaway:
| Insight from Data | Rationale |
| Amazon Go is strategically targeting major global cities. | Seattle, Chicago, London, and NYC are influential urban centers with dense populations. |
| The brand is expanding its global footprint. | Presence in both U.S. and U.K. indicates international growth ambitions. |
| City dwellers are a primary target audience for Amazon Go. | High concentration in major cities implies a focus on urban consumers’ needs and lifestyles. |
Source: Academic Accelerator
Amazon Go’s Debut Store Topped $1 Million in Hardware.
Important takeaway:
| Insight from Data | Rationale |
| Amazon heavily invested in its pioneer Amazon Go store. | The seven-figure hardware expense indicates a significant financial commitment. |
| High initial costs hint at advanced technology usage. | Such a budget suggests the integration of cutting-edge tech for a seamless shopping experience. |
| Future scalability may rely on cost reduction strategies. | While the initial investment is high, optimizing costs would be essential for wider expansion. |
Source: Vested Finance
35% of Millennials, Gen Xers See Amazon Go’s Success.
Important takeaway:
| Insight from Data | Rationale |
| A significant portion of younger generations sees potential in Amazon Go. | Over a third of the polled age groups expect Amazon Go-type stores to thrive. |
| Skepticism remains among a majority of these demographics. | Despite the optimism, 65% remain uncertain or unconvinced of its widespread success. |
| Market education and engagement might boost confidence levels. | Addressing concerns and enhancing store experiences may swing opinions more favorably. |
Source: Supermarket News
Average Amazon Go Spend: $7-$15 Per Trip.
Important takeaway:
| Insight from Data | Rationale |
| Amazon Go attracts modest spending per shopping trip. | Shoppers tend to make smaller, more frequent purchases rather than bulk buying. |
| The store model caters to quick and essential shopping. | Price range indicates a focus on daily essentials or quick grabs rather than extensive shopping. |
| Price optimization is key to maximizing revenue. | Given the spending habits, product pricing and promotions can significantly influence total earnings. |
Source: Retail Dive